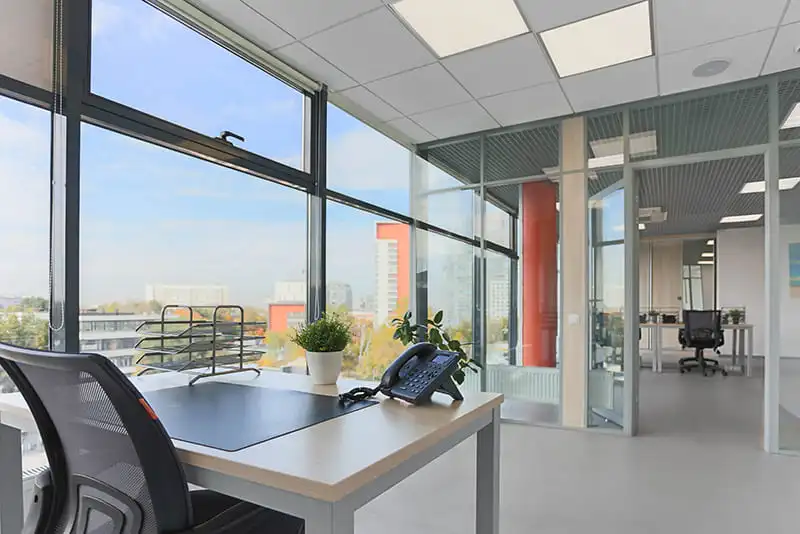
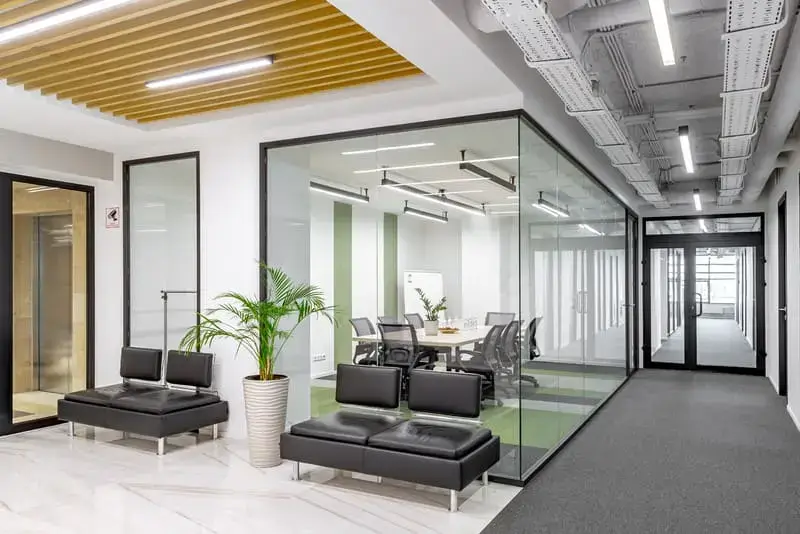
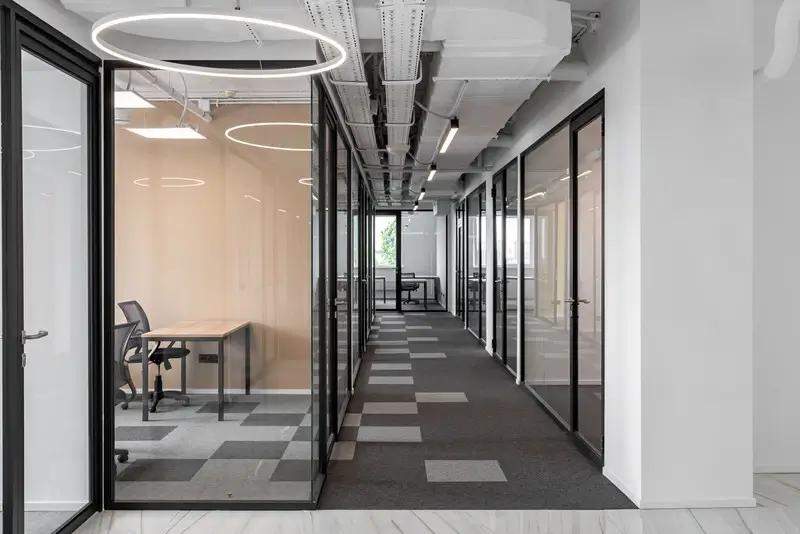
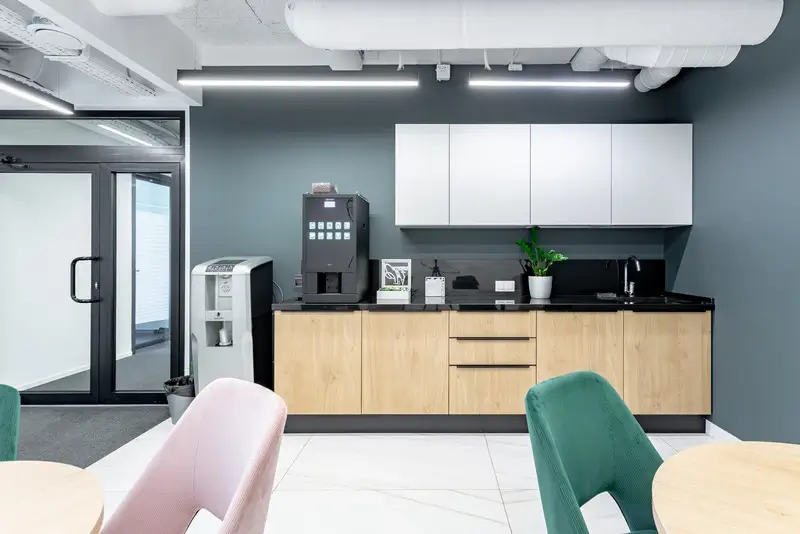
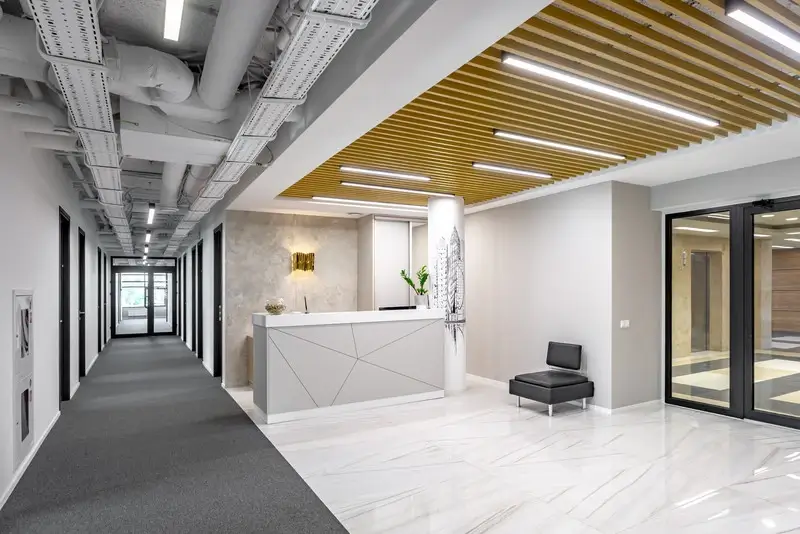
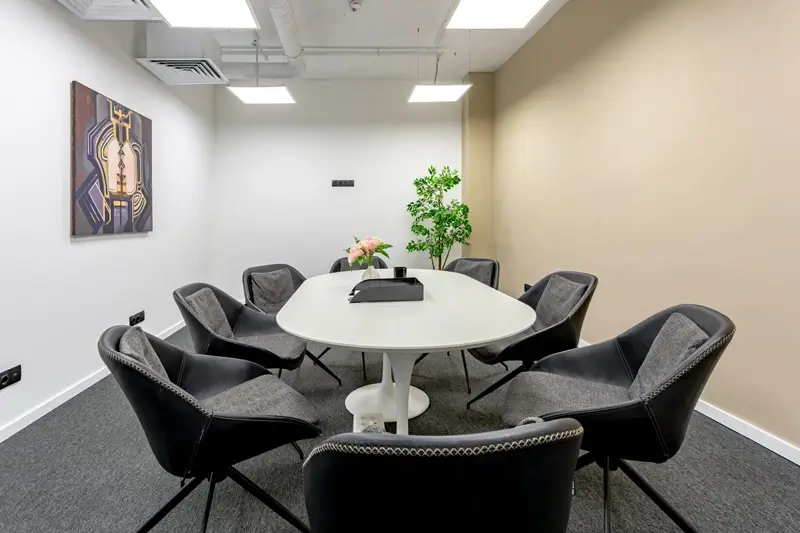
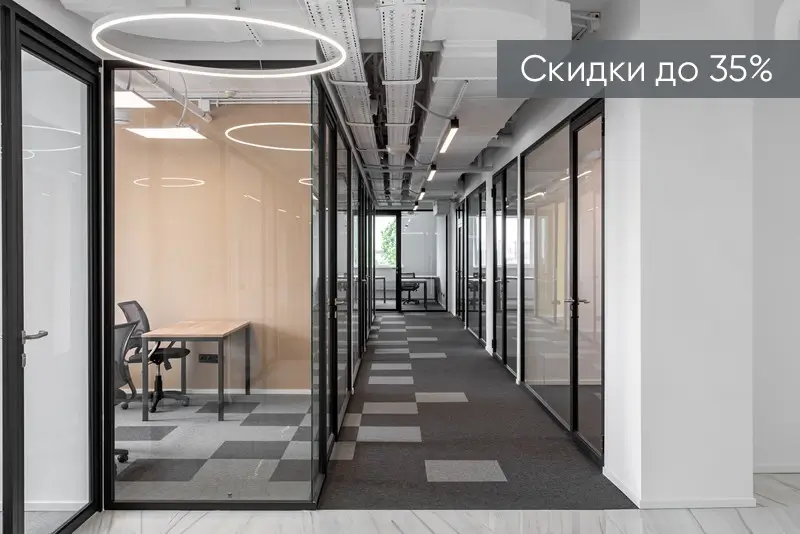
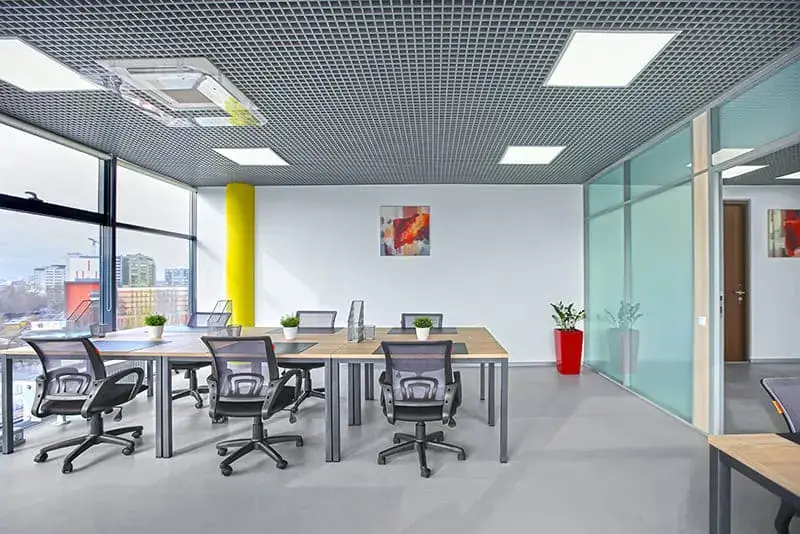
Skip to content

Maybe this will save you some time…

Found another quirk with OBIEE 10g today that I thought I would share.

I opened up one of the reports I have been working on and clicked a navigation link. The nav link goes to a page that contains two reports. Each of the reports sits within a section that contains guided navigation. Well, when I clicked the link to navigate, I was greeted by an empty page. My session log showed that neither report had run and I wasn’t greeted by the typical “Guided navigation is loading” or whatever it says.

Well, turns out that a field that is used in the reports was changed (name change without alias) and broke the report. Typically we would see an error, but in this case, because OBIEE never even ran the report it didn’t show up in the session logs. So if you ever run into a situation where your guided navigation isn’t running and you don’t know why, check to ensure that your guided nav report contains correctly mapped fields.

Creating a Back “Button”

For whatever reason, our client wanted a button that would utilize the browsers “back” feature. One of our guys made this:

<html>
<head>
<script type=”text/javascript”>
function goBack()
{
window.history.back()
}
</script>
</head>
<body>

<input type=”button” value=”Back” onclick=”goBack(-2)” />

</body>
</html>

It’s simple, straight forward and exactly the kind of stuff I like to store in my cabinet.

Narrative View Issues

Recently I came across the following problem:

Users have a strong need to print to PDF for their reports. It was found that using the traditional line break <br> was causing the narrative view to glitch when it got converted to PDF. Users were seeing one single long line of text.

Simple fix for this is to use the [br/] format to create the line break. Figured I would share.

Reports Running without a Date

I recently ran into a situation with a client where they had a detail level report that was only accessibly through a navigation link from a summary level report. It was a straight forward detail level report and had no prompts attached to it.

On occassion, we were seeing this report, that has no prompts, being run without any dates associated with it. Now, this wouldn’t be that much of a surprise, but we have required date fields that are implemented within our ‘Go’ Button, so it’s practically impossible for usere to run the report with at least a single date field being applied.

As it turns out, this user was going to ‘Page Options’, selecting “Clear My Selections” and the detail report was running open ended.

I found that if I just put some default prompt values for fields that I knew would be over written when the report was actually run, I was able to get around this nasty little side step the user had found.

OBIEE 11g Released

There’s been big news in the OBIEE world…Oracle just recently released their latest version of OBIEE, 11g. I know my co-workers and I are pretty excited about it. In the coming weeks I am going to be posting about my experiences using the new software to put together analytic dashboards. I’m looking forward to learning a bunch and sharing what I’ve found with my tiny readership. :) More to come!

Hiding columns in a Table View that can be used in the Pivot Table

Yes, the title of this post isn’t the most eloquent of titles, but it serves the purpose. One of my co-workers was having an issue where he wanted to hide a column that was being displayed in a table but wanted to use that column later on in a pivot table. When he would go and hide the column using the criteria view or through the table view, as you would expect, the column also vanished from the Pivot Table. Now, knowing what I know about OBIEE and how it likes to use order of operations when dealing with showing and not showing various pieces of a report, I figured this issue could be solved in a similar manner and I turned out to be right. The solution is so simple is just makes me laugh, but I am better that many of you out there aren’t aware of this simple trick.

I created this short demo so you can see how I was able to accomplish this. This was done in the Usage Tracking subject area.

Here you can see I hide the Year Column.

I went into the Compound View and added in a pivot table. All is showing as it should with the year column no longer visible.

Here I have trimmed down my Pivot Table to show just the Query Count and the Year.

I now go and change the Year to Hidden, even though it’s already hidden in the criteria view. In the same step, I again go into Year and remove the hidden check mark. This will over-write whatever the Criteria view has set and will allow the column to show up in the report. Simple, but effective.

I know that often times I’ve been asked to create a report using a Table view so as to allow users to use the dynamic sorting functionality and at the same time have wanted to bring in attributes into a secondary pivot, but was unable do so because of the default functionality of the table view…now I can. Enjoy.


Limiting Number of Values Selectable

Recently, I was asked to create a dashboard that emulated another. While I hate trying to mold OBIEE to fit the report design of another dashboard, it did present some unique challenges. One of these was giving the users the ability to select from a list of months, but only allowing them to select 3 months. The customer was concerned that pulling any more than that would lead to performance issues, so I gave it a shot.

The solution that I came up with touches on some of the other techniques that I’ve been using recently in that I relied on creating Presentation Variables through the dashboard prompts.

The first roadblock that I found was that when creating a prompt, you can not utilize the same column twice. At first this seemed like a problem, but then I realized something else. We a filter is created in a report to reference a session variable, if that same field is prompted using a dashboard prompt, the dashboard prompt is going to win out over the presentation variable that’s defined. This is the same way that it works when dealing with values, so I guess I shouldn’t have been too surprised.

How did I get around it? I didn’t use any fields that I was prompting in my report. I selected three arbitrary fields and created a prompt using those. I labeled them “1st Month”, “2nd Month” and “3rd Month” and assigned them presentation variables M1, M2, and M3.

In the “show” field, I defined how I would like my data to show. As you can see, I referenced my month field that I was using for the actual requirements, completely ignoring the actual column that’s being used in the filter.

Next I went to create the filters. This was fairly straight forward.

Once the filters were in place, and there were no “Is Prompted” values referencing any of the false fields in our prompt, we were good to go. Now, when users go into the dashboard, they are given three drop down selectors where they can select distinct months allowing them to see a trending view of the data without the risk of pulling large amounts of data.

Variable Populated Prompts and Using Saved Views

Recently, one of the developers asked me:

“Michael, how do you go about saving a view when one of the prompts on the page contains a variable that populates the initial value (such as date)?”

I explained that I hadn’t really given it much thought. I continued on with my work for the day, not thinking about it much more. Later that day, the developer comes back to me and says:

“I thought you said it couldn’t be done, but you did it on XYZ Report…how did you do that?”

Sure enough, I took a look and was baffled as to how I got it working, as I wasn’t even aware that it WAS working correctly. I had just assumed that whatever value had populated the prompt when the view was saved was the default value.

That day, I took a few hours, researching and looking around for a solution and couldn’t find anything. Even with a working example I couldn’t figure it out. I chalked it up to a strange fluke and kept working on other things.

A few weeks later, a different developer comes to me and asks me how I did that. I explained to him that I had already looked into the issue and couldn’t figure out a solution or a method that allowed me to make it work…as I was sitting there waiting for him to reply, it came to me, so I figured I would share it with the OBIEE Community, as I haven’t seen it posted anywhere.

Problem:

When a user saves a view, all of the selection criteria that is currently populating any prompt will be saved. In a situation where the prompt contains a variable, such as a session variable populating the current date, that evaluated variable is saved. Typically this is not ideal, as items such as dates should change as time passes.

Solution:


Create the dashboard page as you normally would, setting up the sections to allow collapsing. Populate the sessions with all reports, links, etc, except for the prompts which will contain non-static variables. Save the dashboard and go out to the tab to set up your saved view. Collapse sections or set any prompt values that you would like to set up and save your view as you would normally do. Then go back and add in the prompts which contain the variables, save your work and then you will have a saved view that users will be able to use and the evaluated variables will not be saved in the view.

This is odd, as typically, there aren’t many order of operation type functions that have to be followed in OBIEE in order to get reports working the way that we’re looking for.

Happy reporting!

Fun with Presentation Variables

Any OBIEE report developer will tell you that in order to get the most out of the tool, you must know and love working with the various forms of variables available to us. Today, we’re going to talk about a great use for the Presentation Variable that’s available to a user in Answers when editing prompts.

The 6th column in the prompt editor is the “Set Variable”. In this drop down, we’ll be selecting the Presentation variable. For this example, we’ll use the Customer Field, and create a Presentation variable called Customer.

That’s all there is to creating a Presentation Variable using prompts. Now is when you ask, well, “What can we do with it?”

Well, in this case, we can use it to solve a question that I posted in a previous blog entry.

The question was, when using a collapsed section, how will a user know what they have entered into the prompts and if they have actually clicked the “Go” button?


First, we’re going to create a report that will contain our narrative view.

We’ll reference the presentation variable using the @{VALUE} syntax. Set the Rows to display only a single value (as this method will not work with multiple selections). You can set up whatever text formatting that you’d like in this field.

Ensure that your narrative view is the only object in your compound layout. Then, using the dashboard editor, place the saved report below your prompt.

By default, your prompt and narrative view should look like this:

Notice how the narrative shows nothing, as the Customer Presentation variable has not been set. Once a Customer is selected and the “Go” button is pressed, the Presentation Variable will be set and will appear in the narrative report.

Notice how the Narrative has been populated, telling the user they have selected a Customer and are ready to open their collapsed report.

This is only a single example of how to use the presentation variable, but there are many situations where it can be extremely useful.

Happy Reporting!


Opening dashboards without running a query…

I’ve seen this issue brought up a number of times and often I see developers struggling with how to create a dashboard page that will load all their prompts, allow users to select the prompts and then load the report.

I’ve used a few methods in the past to do this, but all of them have issues that make them less than ideal. More often than not, when faced with a situation where a report cannot fire, the following solution is fairly viable and has worked for me in the past. We’ll just call it “The Linking Solution”…

Here’s a typical report. Let’s assume a developer doesn’t want the overhead of running this report without prompt values being populated, but at the same time, doesn’t want to set a default value for the prompts that a user would then have to remove. A straight forward solution is to put a link to the report in place of actually having the report.

While this is a decent approach, it’s limited. The user has no idea if he has actually clicked on the go button, setting his prompt values, and frankly, it’s just not that intuitive.

Also, once a user selects their prompt values, they are stuck with them, as the report will open in a separate window. This can be avoided if you create an additional hidden dashboard page, but in the end, that’s a lot of maintenance for what should be a simple feature.

Another option that can be implemented is collapsing sections.

First make sure you selection is collapsed then save the view.

Saving views is a pretty easy and straight forward method to allow a report to not display. There are a few problems that crop up when using this approach.

  1. If there are any session variables (such as Today’s date) in your prompts, then when that view is saved, the value is saved along with the view. With any report that has a session variable, this issue is a show stopper.
  2. The user has no idea if they have clicked the go button prior to opening the report, which in theory could cause all of this effort to be a waste.

Fortunatly, there are work arounds to these issues.

Problem 1 is solved here.

Problem 2 is solved here.

Happy reporting!